Lost Profits Analysis

The “But-For” World: Why Strong Lost-Profits Analyses Begin Before the Spreadsheet

Lost-profits damages are often presented as a mathematical exercise: forecast the revenue a business expected to earn, subtract the revenue it actually earned, and calculate the difference. That framing is incomplete. The most important work usually occurs before any formula is entered into a spreadsheet.

A credible analysis must construct a supportable “but-for” world—the economic position the plaintiff would likely have occupied absent the alleged wrongful conduct. That requires more than an optimistic forecast. It requires a clear theory of causation, reliable evidence, and assumptions that can withstand examination from opposing counsel, the court, and other experts.

Causation comes before calculation

An expert may be able to quantify a loss, but the calculation is only meaningful if it measures losses connected to the conduct at issue. A decline in sales occurring after an alleged breach does not necessarily mean the breach caused the entire decline. Competitor activity, customer attrition, supply constraints, pricing decisions, regulatory developments, seasonality, or a broader economic slowdown may have contributed.

For that reason, a sound damages model should distinguish correlation from causation. The analysis should identify when the alleged harm began, which customers or product lines were affected, and whether unaffected parts of the business provide a useful benchmark. Contemporaneous budgets, customer correspondence, sales-pipeline records, contracts, operating data, and testimony can be more persuasive than a forecast prepared after litigation begins.

The transaction or opportunity must be supportable

Claims involving a lost contract, prospective customer, licensing arrangement, or new business opportunity require careful attention to whether the opportunity was reasonably likely to occur. A damages model cannot convert an uncertain negotiation into a completed transaction merely by applying a discount rate.

The Arizona Supreme Court’s 2025 decision in McAlister v. Loeb & Loeb illustrates the point. The court rejected a lost-profits theory tied to prospective licensing transactions because material deal terms remained unresolved. The lesson extends beyond that case: experts should examine the evidence supporting both the existence of the opportunity and the amount of profit allegedly lost.

Revenue is not profit

Another common error is treating lost sales as lost profits. If sales would have increased in the but-for world, the company may also have incurred additional labor, materials, commissions, shipping, marketing, working-capital needs, or other incremental expenses. Those avoided costs must be considered.

The classification of costs deserves particular care. An expense labeled “fixed” in the general ledger may become variable over a longer damages period. A business near capacity might have needed another shift, additional equipment, or expanded facilities to generate the projected revenue. Conversely, some overhead may not change at all. The analysis should reflect economic behavior, not simply accounting labels.

Mitigation and post-event evidence

A plaintiff generally cannot ignore reasonable opportunities to reduce its loss. Replacement sales, new customers, substitute suppliers, insurance recoveries, and operational changes may affect the damages calculation. Post-event results can also test whether earlier assumptions were realistic, although hindsight should not be used selectively.

A useful model often presents more than one scenario. Sensitivity testing can show how damages change when assumptions about growth, customer retention, margins, or the loss period change. This does not weaken the opinion. It helps decision-makers understand which assumptions drive the result.

A defensible story

The strongest lost-profits analyses align the legal theory, factual record, and financial model. Each major assumption should have an identifiable source, and the path from the alleged conduct to the claimed loss should be understandable without relying on spreadsheet complexity.

Ultimately, precision is not the same as reliability. A model can calculate damages to the dollar and still rest on an unsupported premise. The goal is not to build the most elaborate forecast. It is to present a transparent, evidence-based reconstruction of what most likely would have happened.
Case Study: Financial Litigation Support – Quantifying Economic Damages from a Data Center Fire

Executive Summary:

In March 2025, TechPro Systems, Inc., a SaaS provider, experienced a catastrophic fire at its primary data center. The incident caused extended service outages, significant operational downtime, and the loss of several key clients. Lakelet Advisory Group, LLC was retained to assess and quantify the resulting economic damages, including lost profits, client attrition, and associated mitigation costs. Following a detailed financial analysis, our team concluded that the total damages sustained amounted to approximately $16.2 million.

Background:

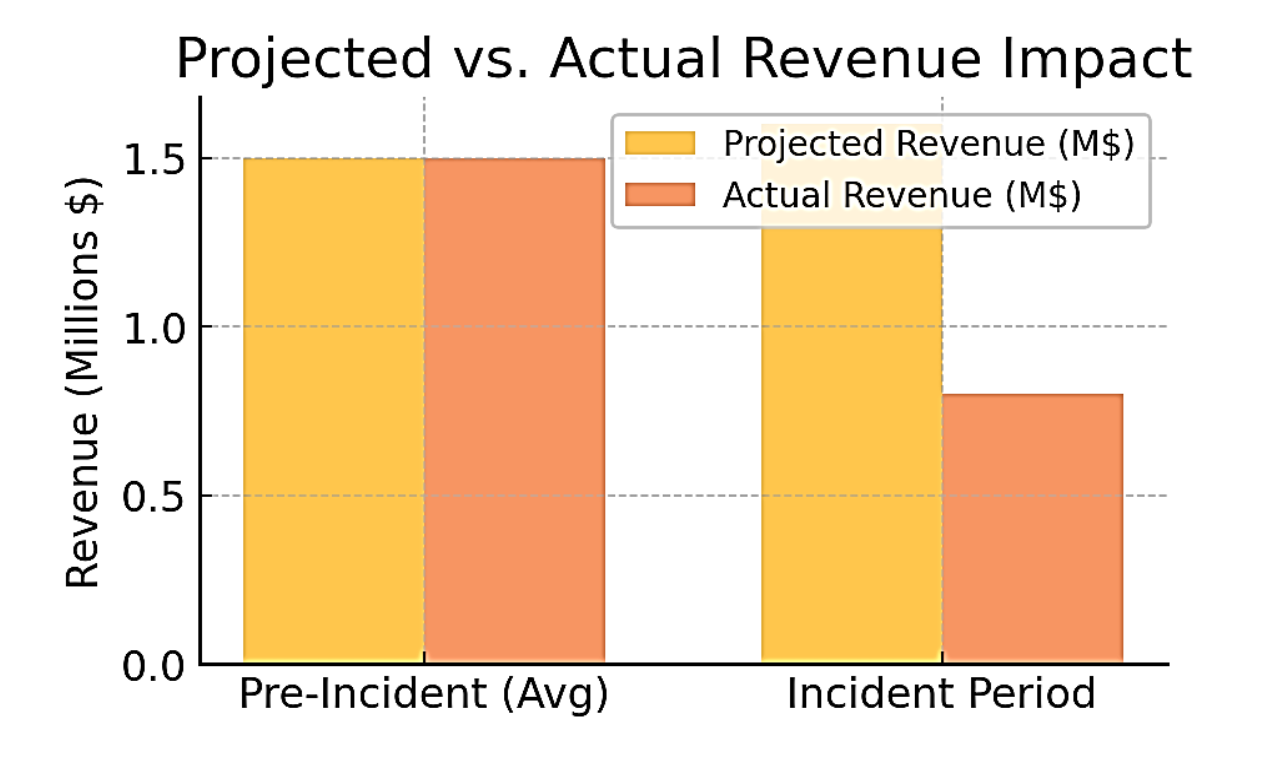
The fire resulted in a 17-day full outage, followed by 45 days of partial operations. The company lost key clients and experienced reputational damage, leading to the abandonment of $4.8 million in new contracts.

Scope of Engagement:

TechPro Systems, Inc. endured a prolonged operational disruption following the data center fire, with 17 days of complete outage and an additional 45 days of limited-service capacity. The prolonged instability resulted in approximately 15% client attrition, significantly impacting recurring revenue. Compounding the loss, the company forfeited $4.8 million in new business from abandoned contracts during the recovery period. In parallel, TechPro incurred $2.1 million in incremental expenses, including temporary server deployments, recovery operations, and customer compensation credits. Over a projected 12-month period, the cumulative impact of these disruptions led to an estimated $9.3 million in lost profits.

Key Methodologies:

  • But-for Financial Model using 2021–2023 performance as a baseline.

  • Customer Churn Analysis using historical churn data and client interviews.

  • Business Interruption Framework aligned with AICPA Practice Aid.

  • Discounting Future Losses using a 10% risk-adjusted discount rate.

Findings:

The total economic damages were quantified as follows:

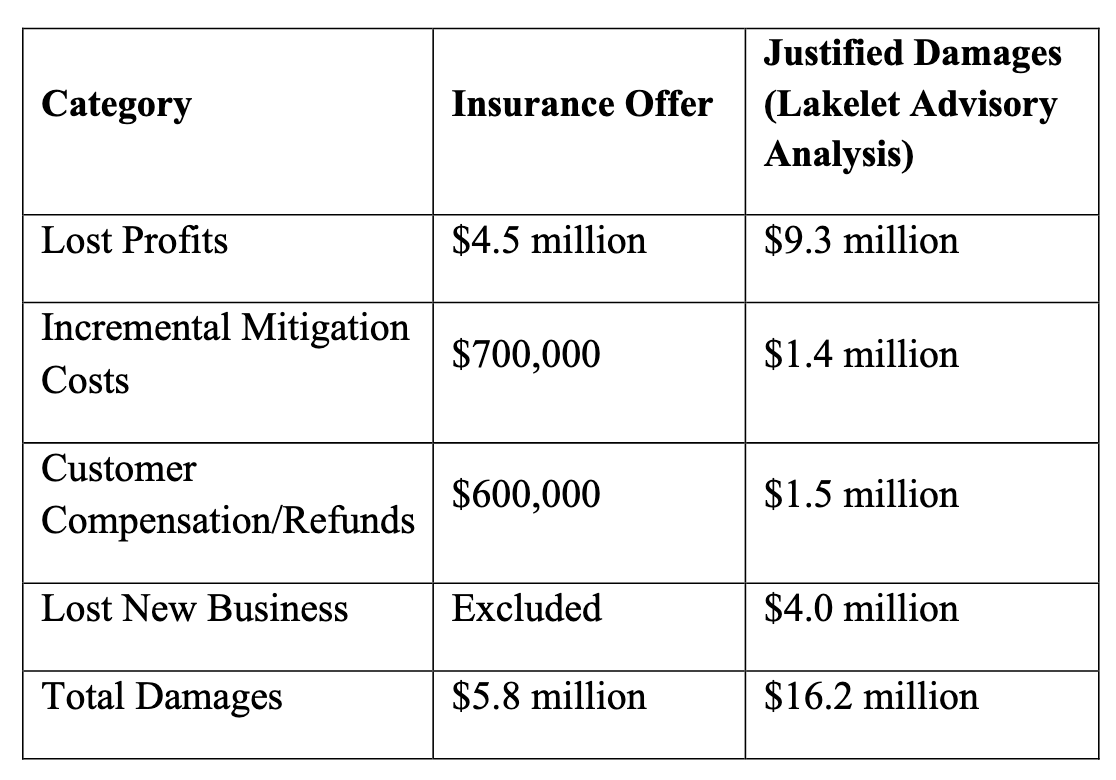
  • Lost Profits: $9.3 million

  • Incremental Mitigation Costs: $1.4 million

  • Customer Compensation/Refunds: $1.5 million

  • Lost New Business: $4.0 million

  • Total Damages Quantified: $16.2 million

Outcome:

Our expert testimony supported the plaintiff’s claim, leading to a settlement of $13.6 million.

Exhibit 1: Projected vs. Actual Revenue:

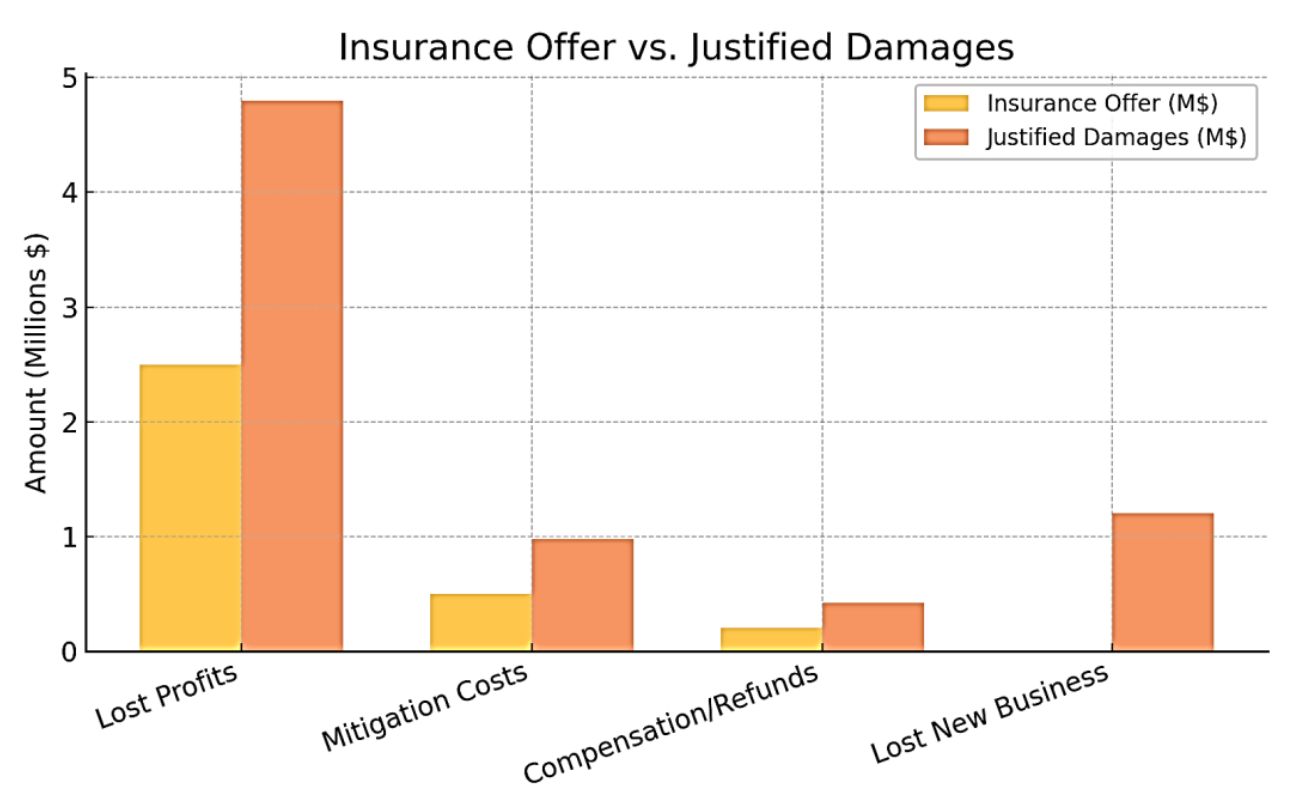
Insurance Offer vs. Justified Damages:

As part of the litigation process, TechPro Systems, Inc. filed a business interruption and property damage claim with its insurance provider. The initial insurance settlement offer was deemed insufficient compared to the true economic impact of the disaster. Our analysis provided a detailed rebuttal with substantiated financial modeling, leading to a favorable settlement.

Our evidence-based analysis nearly tripled the recognized damages from the insurance provider’s initial offer. This detailed quantification of downtime, client attrition, and lost future contracts proved essential in negotiating the final settlement.

Exhibit 2: Insurance Offer vs. Justified Damages:

Final Settlement Outcome:

After arbitration, the company received approximately 84% of the damages quantified by Lakelet Advisory Group, resulting in a final recovery of approximately $13.6 million (84% of $16.2 million).

Economic Loss Methodologies Utilized:

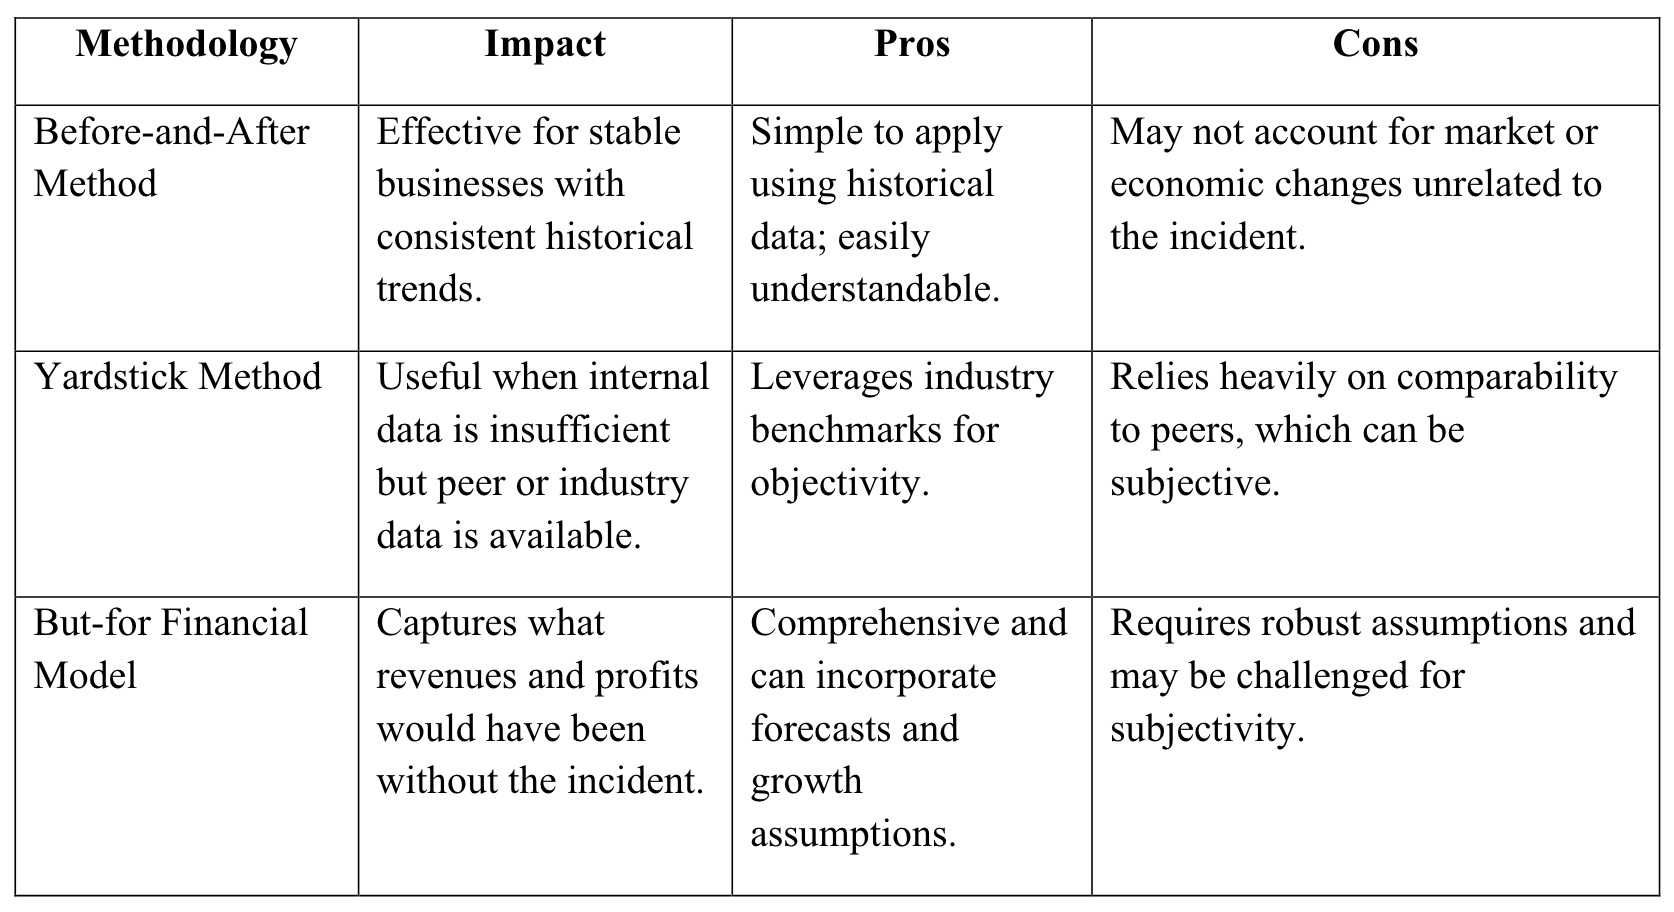
The following economic loss methodologies were considered and could have been utilized to quantifydamages resulting from the disaster:

  • Before-and-After Method – Compares the company’s actual performance post-event to its historical performance prior to the incident, isolating the financial impact of the disruption.

  • Yardstick Method – Uses comparable companies or industry benchmarks to estimate what the company’s performance would have been but for the incident.

  • But-for Financial Model – Constructs a projection of revenue and profits assuming the event had not occurred, and contrasts this with actual results to determine lost profits.

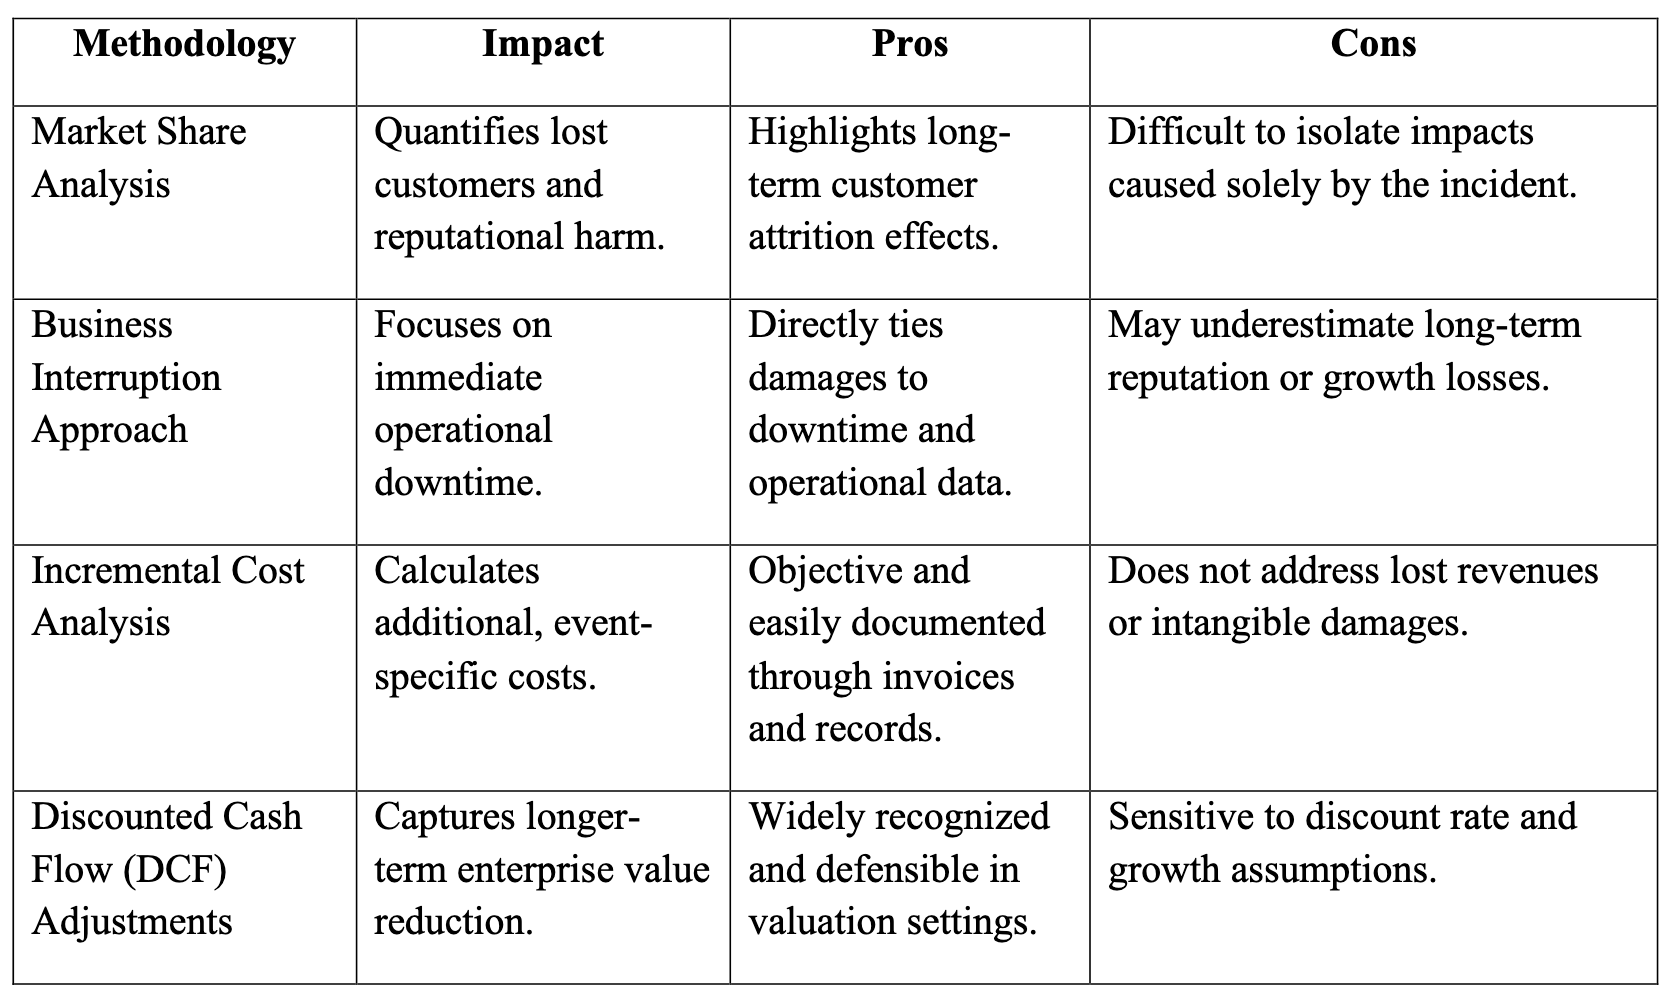
  • Market Share Analysis – Evaluates lost customers or market share due to reputational harm and quantifies the future revenue impact over the recovery period.

  • Business Interruption Approach – Estimates the period of full and partial operational downtime and applies margins to calculate lost income during that period.

  • Incremental Cost Analysis – Quantifies additional costs incurred for mitigation, temporary services, or client retention that would not have been incurred otherwise.

  • Discounted Cash Flow (DCF) Adjustments – Applies discounted cash flow techniques to quantify longer-term losses or reduced enterprise value due to the incident.

Methodology Impact Analysis:

The table below summarizes the potential impact of each economic loss methodology, along with its key pros and cons.

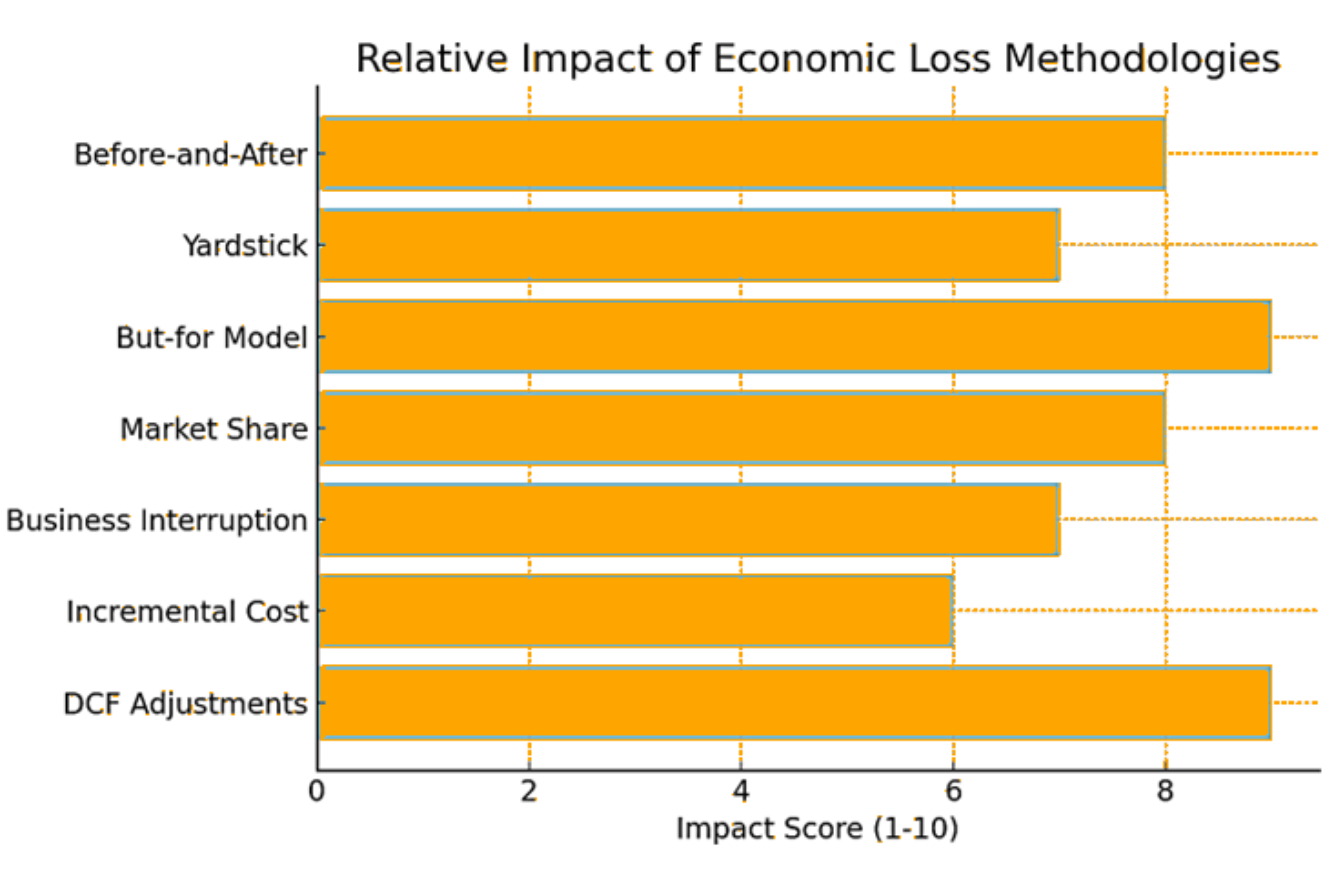
Exhibit 3: Impact of Economic Loss Methodologies:

Conclusion:

The But-for Financial Model and Discounted Cash Flow (DCF) Adjustments proved to be the most impactful methodologies in substantiating the claim and reaching a favorable settlement. These approaches effectively quantified both the immediate loss of profits and the longer-term effects on enterprise value. By incorporating client attrition and business interruption data, the analysis delivered a comprehensive assessment of both short-term disruptions and lasting financial harm. Ultimately, this integrated, multi-method strategy—underpinned by robust financial modeling—enabled the company to recover 84% of the total quantified damages, amounting to $13.6 million out of $16.2 million. This outcome underscores the critical importance of leveraging a tailored combination of loss quantification techniques, aligned with the unique circumstances of each case.